Showing How 28,000 Developers Feel About the State of the Web
Freelance Designer @ Mozilla (2019)As the designer on a small team, I worked with the author and project manager to design a 100 page pdf report for a large research project.
Project Overview
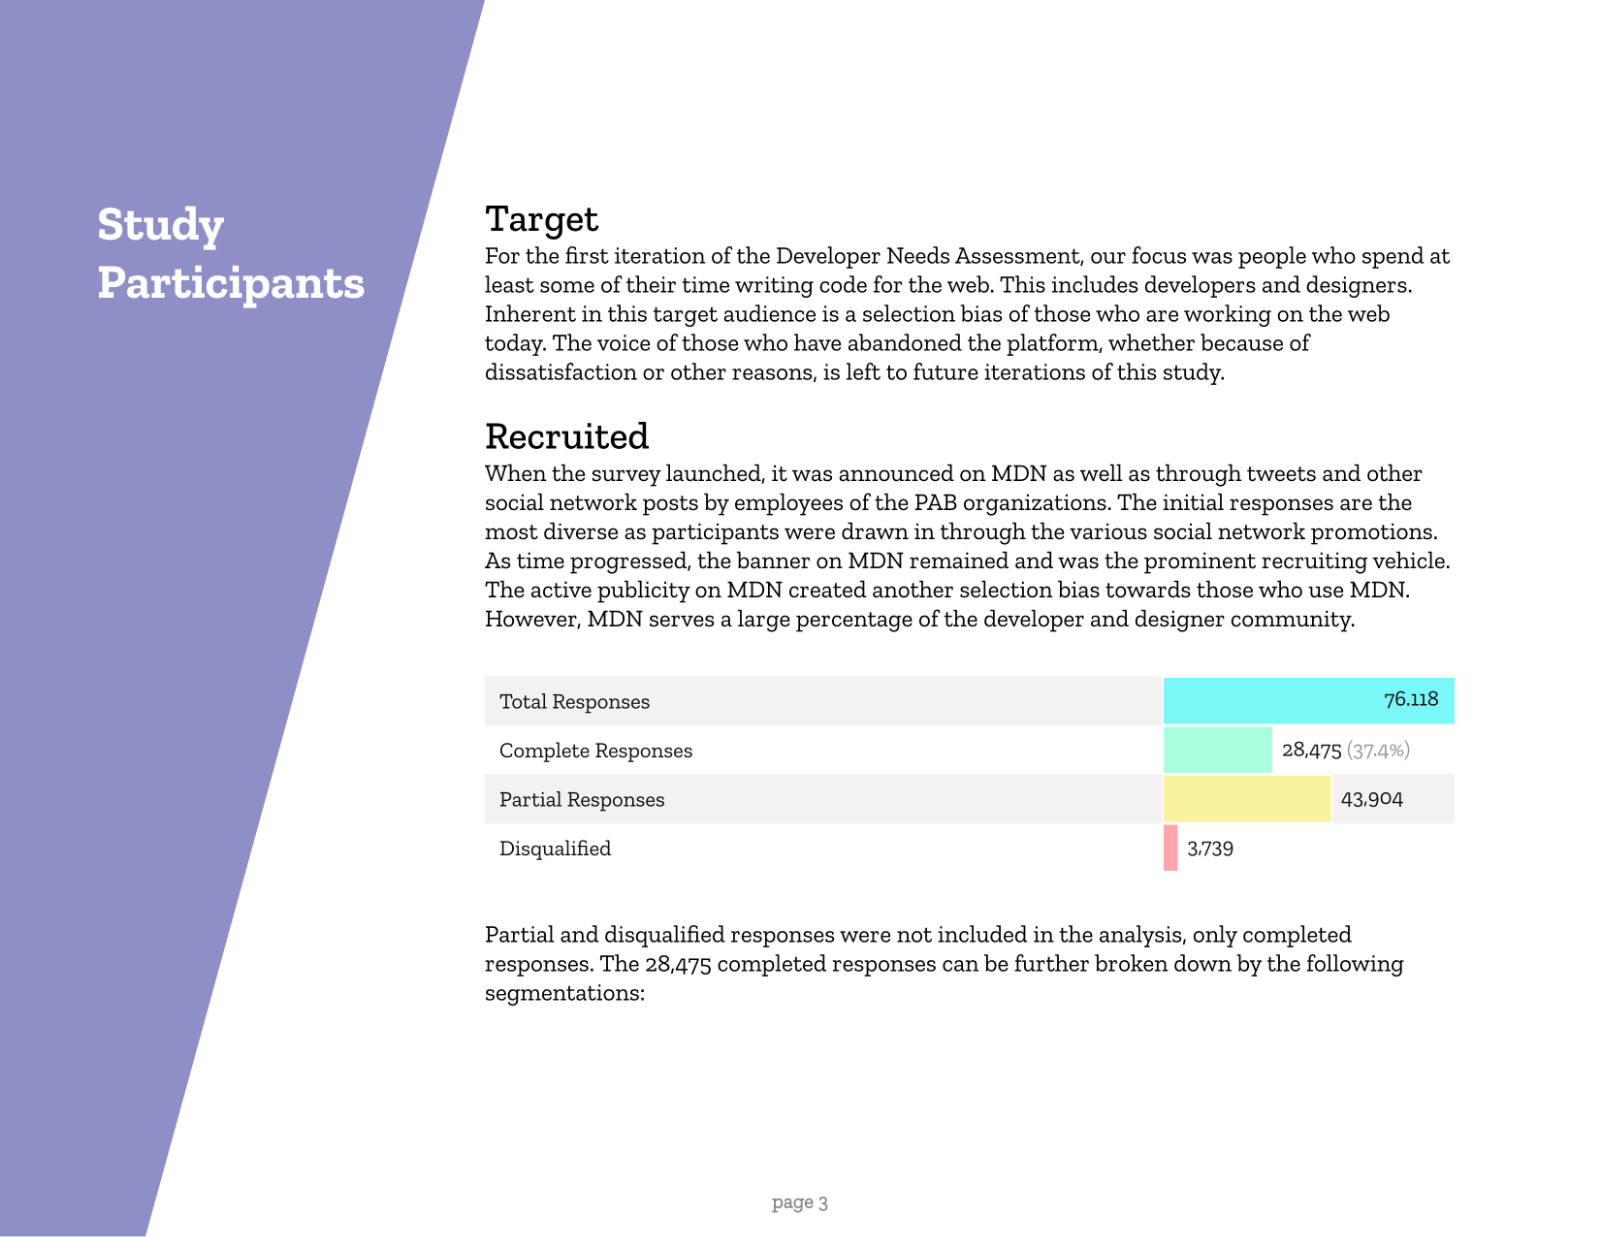
Mozilla sponsored a survey of more than 28,000 developers and designers from 169 countries to help understand their pain points, wants, and needs. Pinpoint conducted the study, which included 10,000 hours of input from the community, and wrote the report.
I designed the report bringing 50+ pages of text from a Google doc to life. I designed a set of icons based on Mozilla’s style guide representing the themes of the report and created over a dozen graphs to visualize the data. It is likely the largest web developer and designer focused research study ever conducted.
Report Layout
I designed the layout for the report working from Mozilla's existing color palette, typography, and style guidelines. I argued for (and initially designed) the report in portrait orientation for a better experience on mobile devices, but the stakeholders at Mozilla insisted on creating the report in landscape orientation. Once the report was released it was clear that Mozilla was wrong about that one.
Icon Development
I drew up a set of icons to represent the themes in the report using Mozilla's existing style guide and icon set for reference. Once I was happy with the sketches I created various versions for use in the report, using their somewhat garish color palette.
Exploring Data Viz Concepts
We wanted a way to visualize categorical data and rankings, so I collected some options to explore. I used an alluvial diagram to show the relationship between categories and themes, and a hybrid alluvial/bump chart to show how rankings varied by segment.


← Back